A full-stack Django web application built to support database performance tuning workflows. Connects to Snowflake, Teradata, and Oracle simultaneously — surfacing query execution history, compute metrics, and statistical analysis across multiple enterprise data warehouse platforms.
Connects simultaneously to Snowflake, Teradata, and Oracle using dedicated Python connectors — each with independent connection configuration and error handling.
Query Performance Analysis
Surfaces execution history with metrics like elapsed time, CPU time, bytes scanned, logical/physical I/O, compile time, and spill-to-storage — per platform.
Statistical Metrics
For both the full result set and the filtered selection, calculates subtotal, average, and standard deviation — giving engineers a statistical view of workload variability.
Oracle Workload Integration
Queries the BEZNext Oracle workload management system to look up system names, ruleset names, AppIDs, and usernames — enabling precise Teradata workload filtering.
Query Filtering & Controls
Date range pickers, warehouse/system/ruleset dropdowns, sort column selector, and result count limiter — each dynamically populated from live database metadata.
Query Text Popup
Click any Query ID in the results table to fire an AJAX request that fetches and displays the full SQL text for that query live from the source database.
Snowflake
Query history analysis across Snowflake warehouses
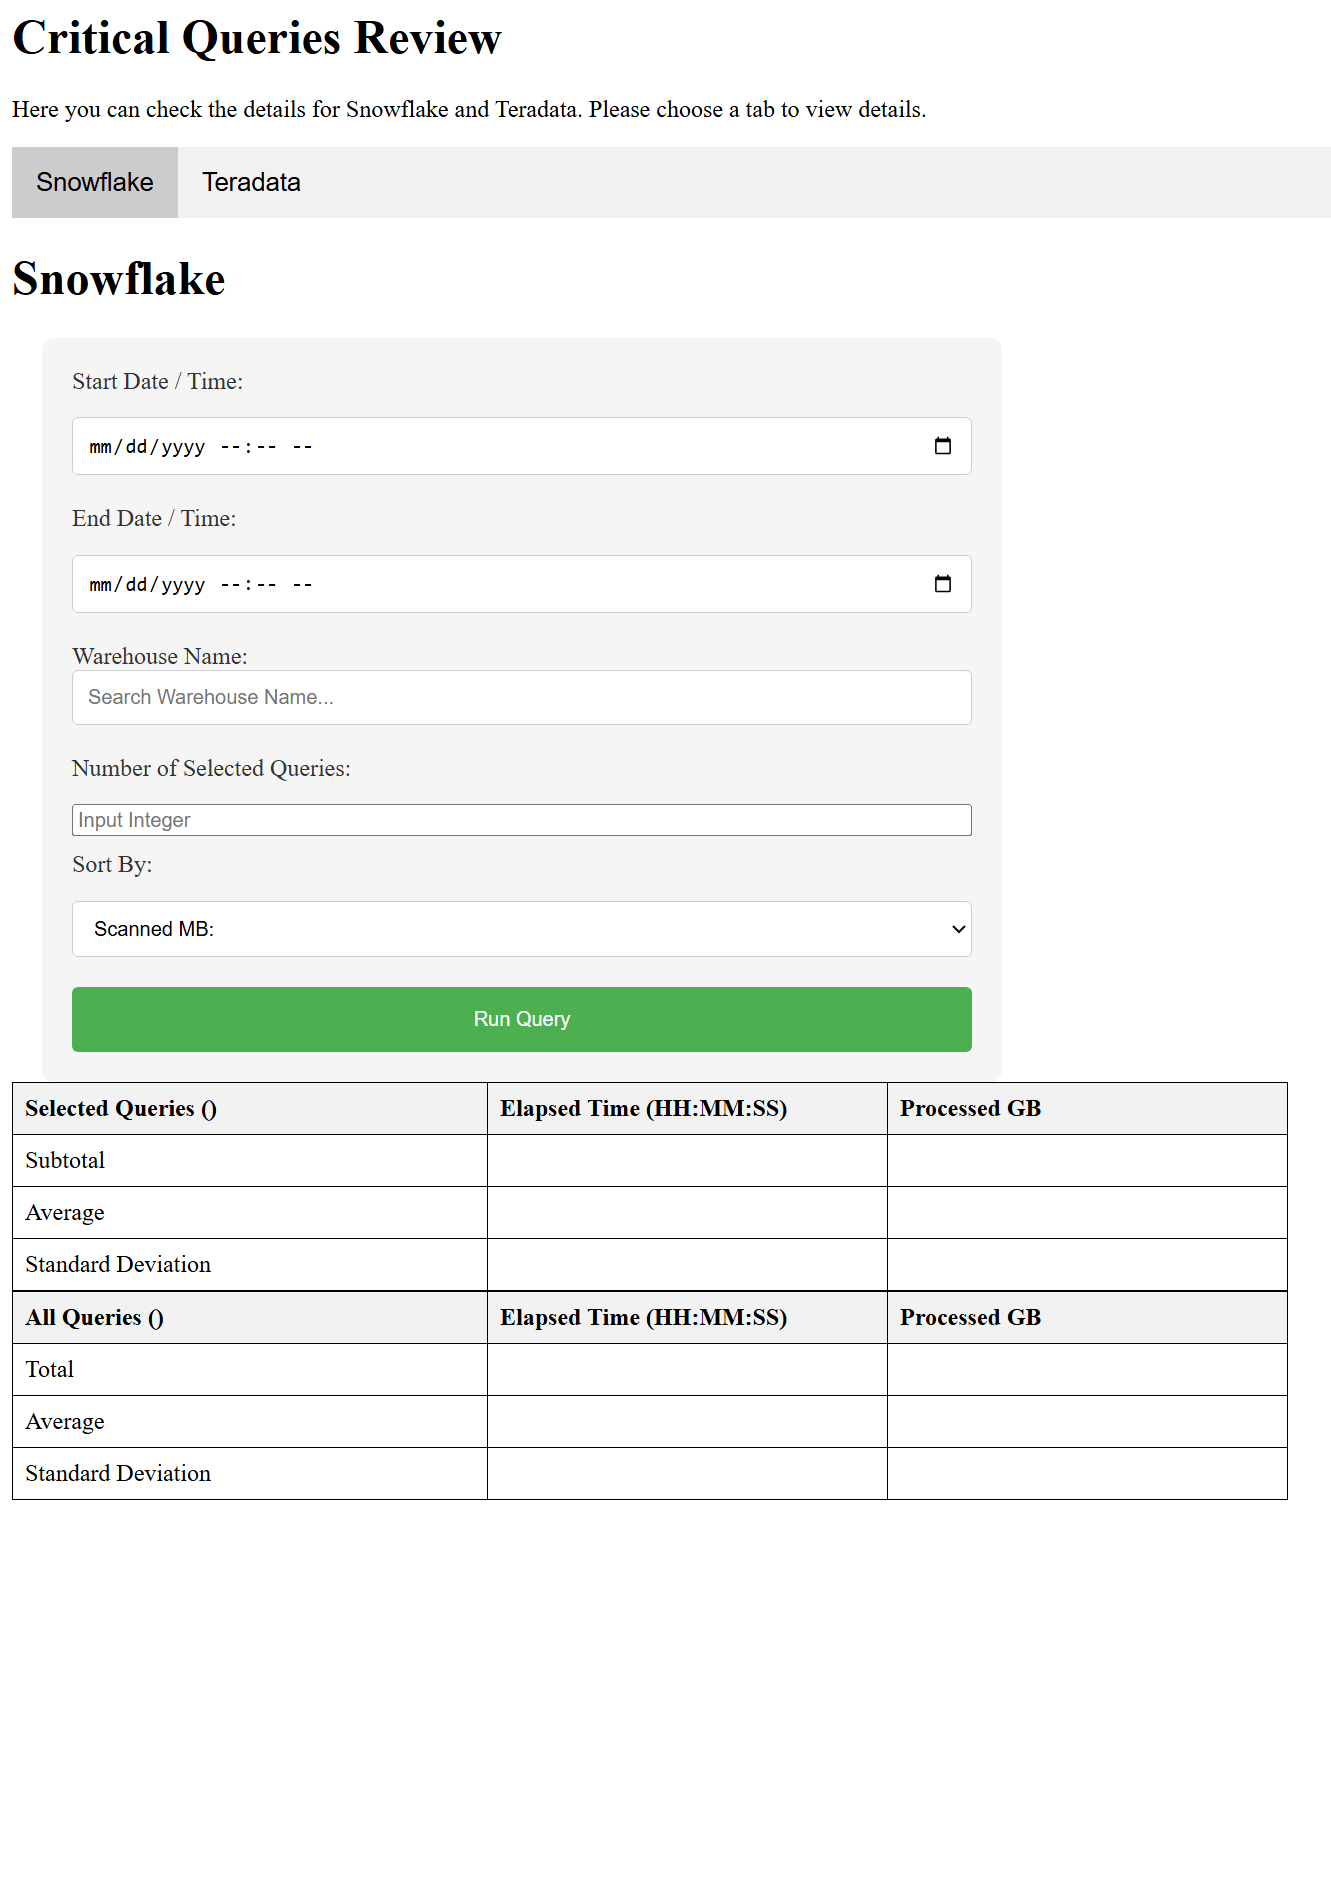
The Snowflake tab queries ACCOUNT_USAGE.QUERY_HISTORY to pull execution data filtered by date range, warehouse name, and result limit. Results are processed into a pandas DataFrame before statistics are computed and rendered.
Filter by start/end datetime and warehouse name
Sort by Scanned MB, elapsed time, compile time, execution time, or network usage
Results table shows Selected Queries and All Queries blocks with subtotal, average, and standard deviation rows
Click any Query ID to fetch and view the full SQL in a popup
Teradata
Workload-filtered Teradata query analysis
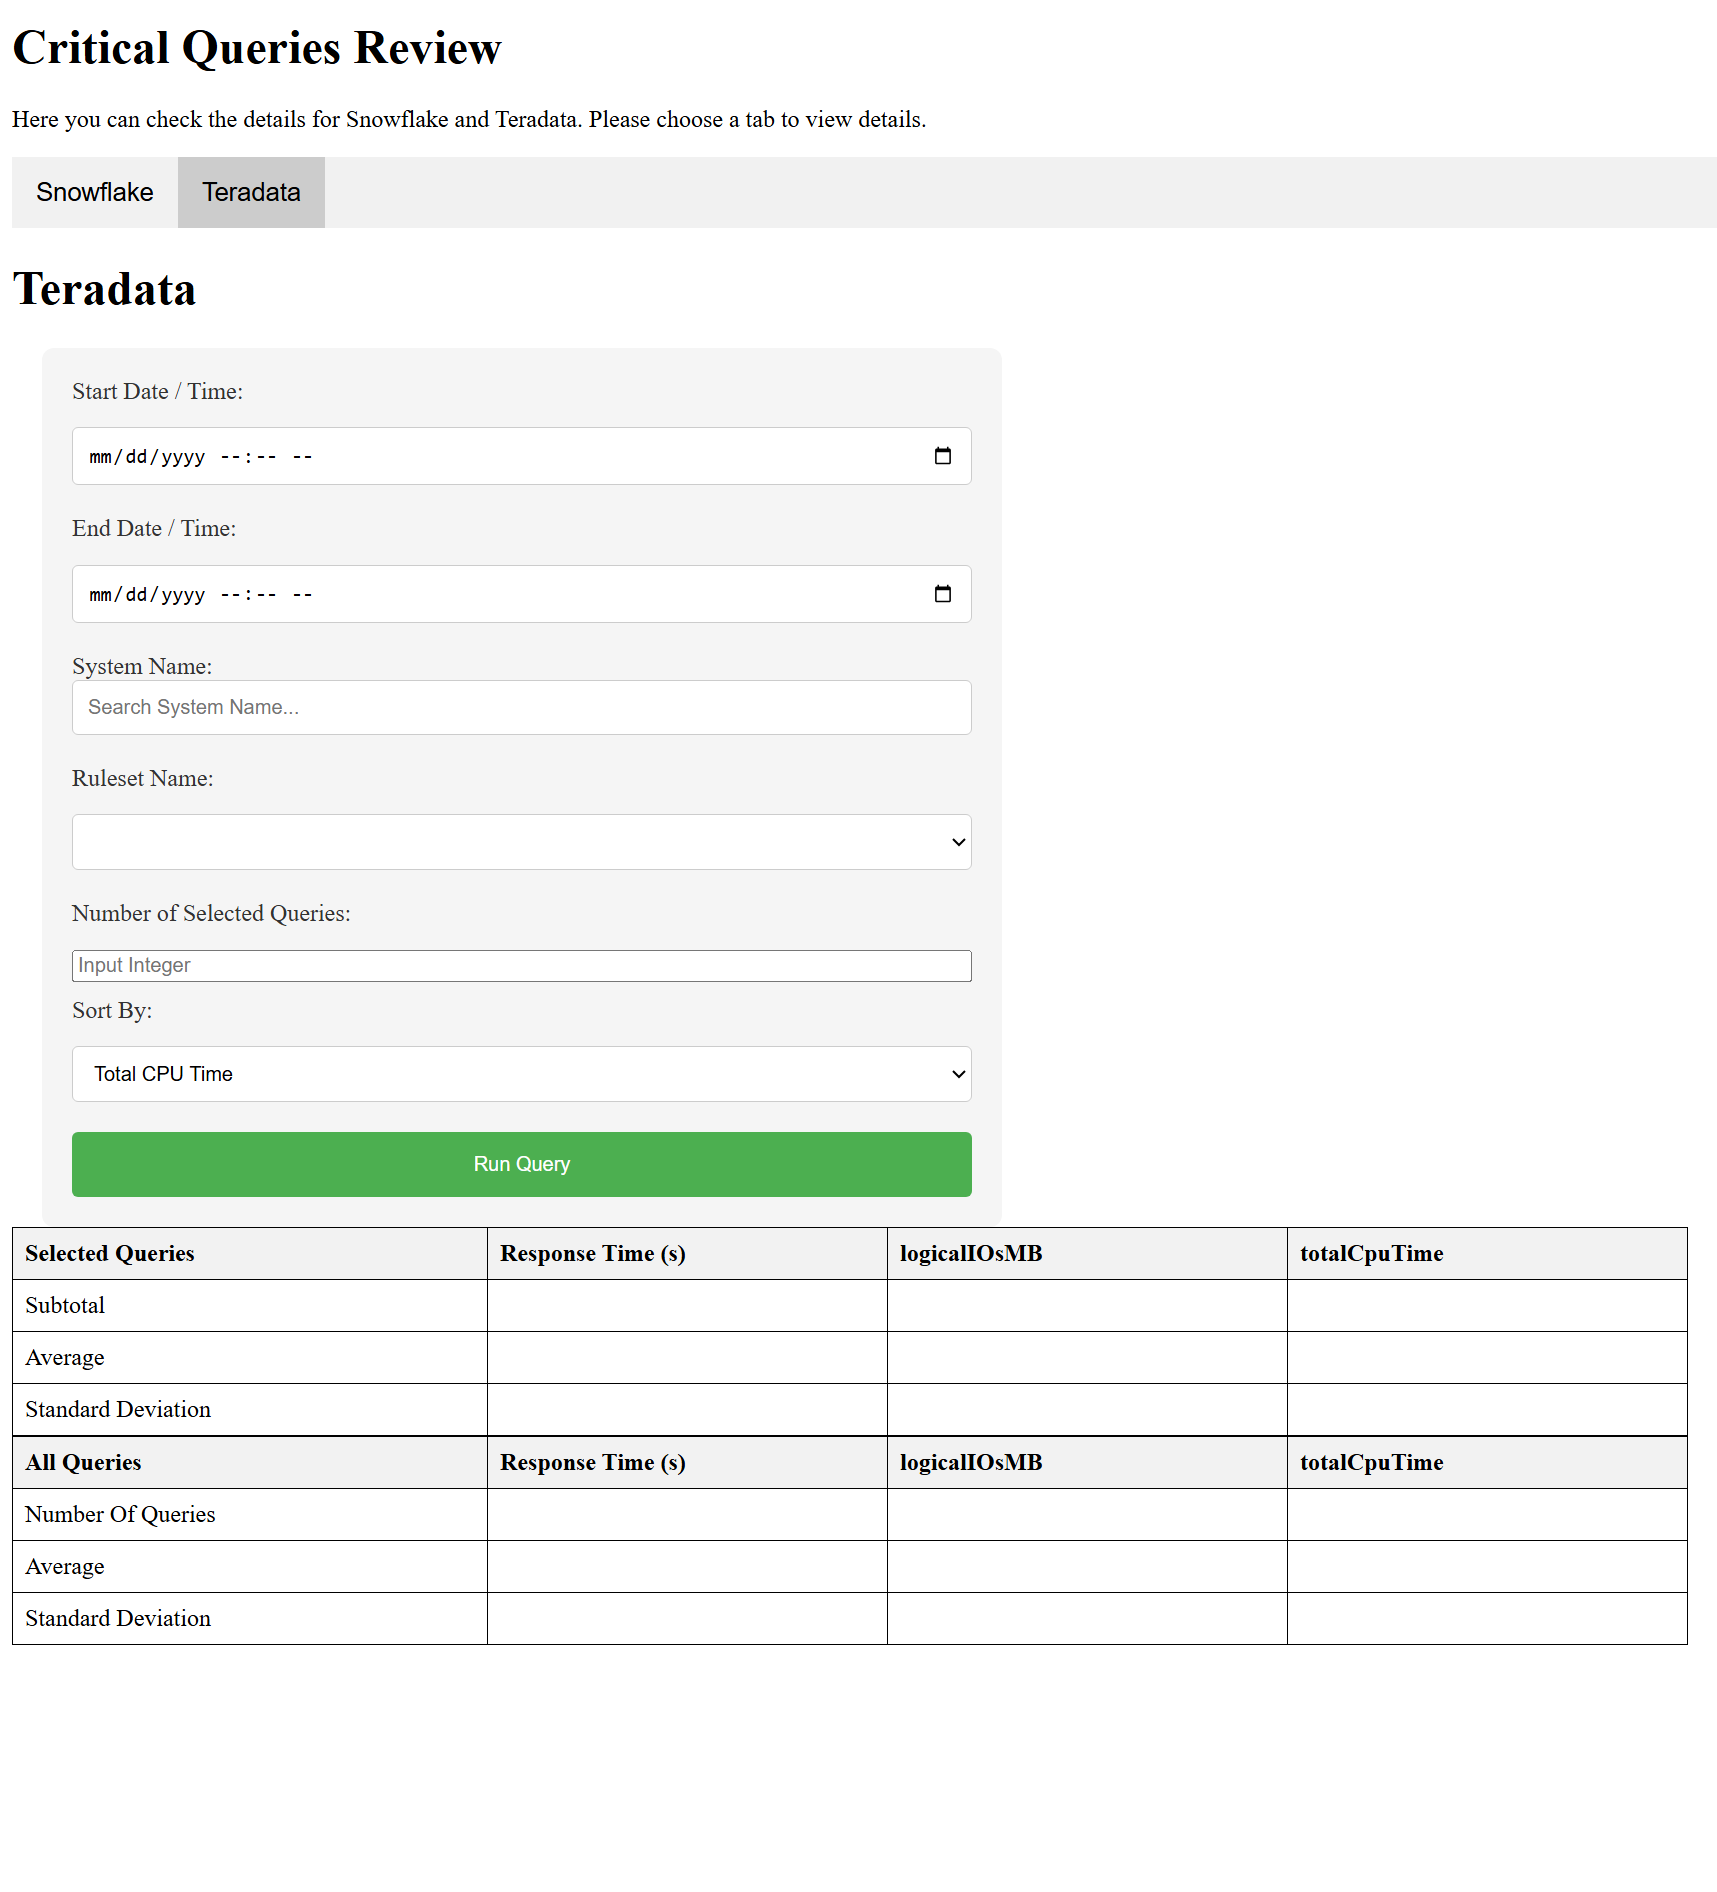
The Teradata tab adds an Oracle-backed workload layer: the app first queries the BEZNext Oracle system to identify the AppIDs and Usernames active during the selected window, then uses those to filter DBQLOGTBL_HST_V for matching queries.
System Name and Ruleset Name dropdowns populated live from Oracle workload metadata
Sort by Total CPU Time, logical/physical I/O (MB), or response time
Results table shows Response Time, logicalIOsMB, and totalCpuTime across selected and all query sets
Rotating log files track Teradata, Oracle, and server activity separately
Workflow
How a query runs end to end
01
User submits the form
Selects date range, platform (Snowflake or Teradata), warehouse or system/ruleset, sort column, and result limit.
02
Oracle pre-query (Teradata only)
For Teradata, the app queries Oracle's model_session_metrics to find active AppIDs and Usernames in the time window.
03
Database query execution
The parameterized SQL query runs against Snowflake or Teradata with the user's filters applied, returning raw execution records.
04
pandas processing
Results are loaded into a pandas DataFrame. Subtotals, averages, and standard deviations are computed across the full set and the selected subset.
05
HTML table render
The processed DataFrame is rendered into an HTML response with clickable Query IDs that trigger AJAX calls for full SQL text retrieval.